Biological Data
The Hudson River Estuary Program provided support for many of the following initiatives. If you have difficulty obtaining copies of corresponding reports and GIS data from the links included below, contact our team for assistance.
Watershed-Wide Data
Significant Biodiversity Areas (SBAs)
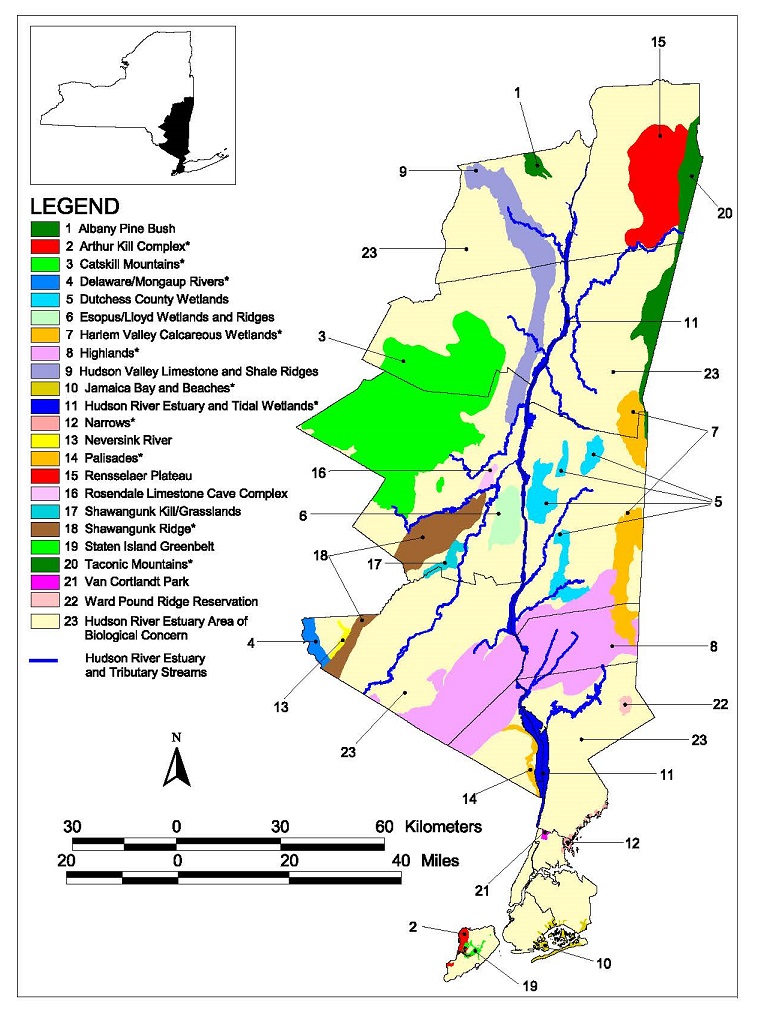
SBAs are locations of high concentration of biological diversity or value for regional biodiversity in the Hudson estuary watershed. The Hudson River Estuary Wildlife and Habitat Conservation Framework (Penhollow et al. 2006), developed by the Estuary Program and Cornell, includes a map of these 23 areas with descriptions. Partners working within and near the SBAs can collaborate on conservation strategies to preserve their high biological value and maintain landscape connectivity.
The Framework is available at the DEC website and GIS data are available to download from the NYS GIS Clearinghouse.
Core Forest Patches
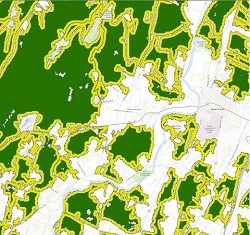
Forests are a critical component of healthy watersheds, and to better understand the current size and distribution of forests in the estuary watershed, we collaborated with the New York Natural Heritage Program (NYNHP) in 2019 to update our previous forest patch data. Using the 2016 National Land Cover Database, NYNHP used buffered roads, railroads, and non-forest habitat to delineate patches of forest greater than 100 acres in size, and then applied the UConn Center for Land Use Education & Research (CLEAR) Landscape Fragmentation Tool to identify core forests. The cores represent forest patches surrounded by at least 100m of forest. We expect that core forests have greater ecological value due to less impact from edge effects and fragmentation. Core forest data can be included in inventories, resource prioritization, and land-use plans to identify where conservation measures and decisions can support larger, intact forests and landscape connections between forests. More information on the project is available at the NYNHP website and the core forest data can be downloaded from the NYS GIS Clearinghouse.
Forest Condition Index
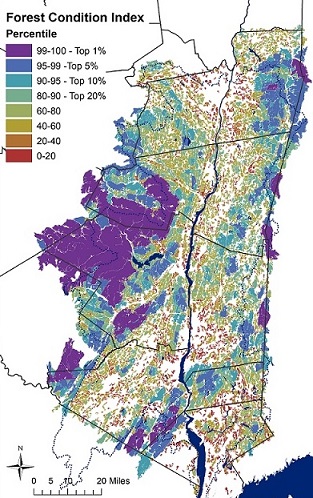
To characterize the condition of forest patches in the estuary watershed, we continued our collaboration with NYNHP in 2019 to develop a condition index. Using GIS analysis, NYNHP assessed each patch for 22 components that considered aspects of fragmentation, connectivity, stress, ecosystem value, and carbon sequestration. The resulting index indicates the condition of each forest patch relative to the other patches in the watershed, and can be used as a tool for conservation planning. For example, the condition index can aid municipalities, land trusts, and watershed groups in setting conservation priorities, or informing site planning and land management, to protect high-quality habitat, wildlife pathways, ecosystem services, and other benefits of importance to the community.
For more information or to download the GIS data and a fact sheet, visit the NYNHP website. A recorded webinar about the Forest Index is available here.
Natural Heritage Important Areas
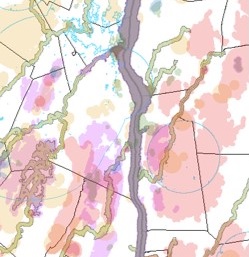
Also developed by NYNHP, the Important Areas data set includes the lands and waters needed to support the continued presence and quality of documented occurrences of rare animals and plants, rare ecological communities, and/or high-quality examples of common ecological communities in the estuary watershed. By delineating zones that are important to the health of rare species and significant ecological communities, Important Areas provide valuable information to add to inventories, resource prioritization, and land-use plans.
For more information or to download the most recently updated GIS data (2018) and a fact sheet, visit the NYNHP website. A recorded webinar about the Important Areas data is available here.
Local Project Data
Several mapping initiatives have created finer-scale biodiversity data in specific locations in the estuary watershed. By also considering these local biodiversity data and maps early in the planning process, planners can avoid or minimize impact to important natural areas, habitats, and landscape connections.
Habitat Maps
Hudsonia Ltd. has completed many projects that utilize GIS analysis and field assessment to identify, map, and describe habitats of special ecological importance. Habitat maps and reports are available for 10 town-wide projects in Dutchess County and Woodstock in Ulster County; selected watersheds and stream corridors in Albany, Greene, Orange, and Schoharie counties; and other large areas in Ulster and Dutchess. More information on the process, project locations, and available maps and reports is available on the Hudsonia website.
Biodiversity Assessment Training Maps
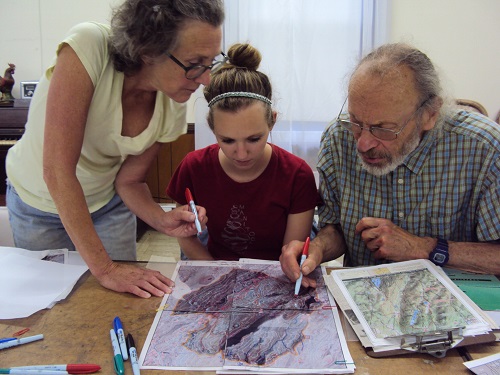
With support from the Estuary Program, Hudsonia Ltd. trained municipal groups to use remote sensing techniques to predict locations of ecologically-significant habitats. The 10-month Biodiversity Assessment Training utilized the Biodiversity Assessment Manual as a course textbook and volunteer groups applied newly-learned mapping skills to a study area in their community.
Biodiversity Corridor Plans
The Metropolitan Conservation Alliance (MCA) completed several biodiversity projects in the estuary watershed that encouraged intermunicipal approaches to conservation of wildlife and habitats. MCA collected field data and conducted map analysis to delineate high-quality habitat areas and connections, and provided recommendations for sustaining the value of these areas. Plans were developed for parts of Orange, Putnam, Ulster, and Westchester counties, and include the Croton-to-Highlands Biodiversity Plan (2004, plus subsequent addendums); Eastern Westchester Biotic Corridor (2002, plus subsequent addenda); North Castle Biodiversity Plan (2007); Northern Wallkill Biodiversity Plan (2007); Pocantico Hills Biodiversity Plan (2006); and Southern Wallkill Biodiversity Plan (2005). Contact us to see if we have a copy of the document or information that you need.
Woodland Pool Mapping
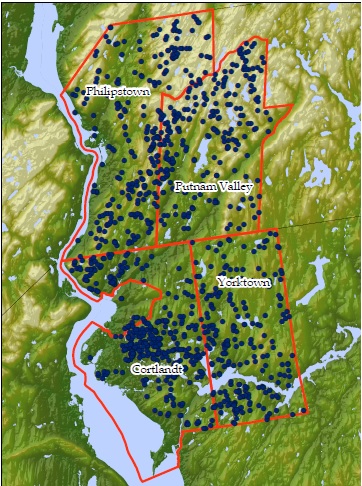
With funding from an Estuary Grant, Teatown Lake Reservation developed a map of potential woodland pool locations in four towns in Putnam and Westchester counties (Cortlandt, Philipstown, Putnam Valley, and Yorktown). Aerial photograph interpretation was used to map potential locations and a small number of pools were field-verified. Although additional volunteer effort is needed to further ground-truth the data, the map of potential locations can still be considered for general planning purposes. Maps, GIS data, and the report, Mapping Woodland Pools in the Hudson Hills and Highlands (2013), can be obtained through our program.